deZemBoard for any target group
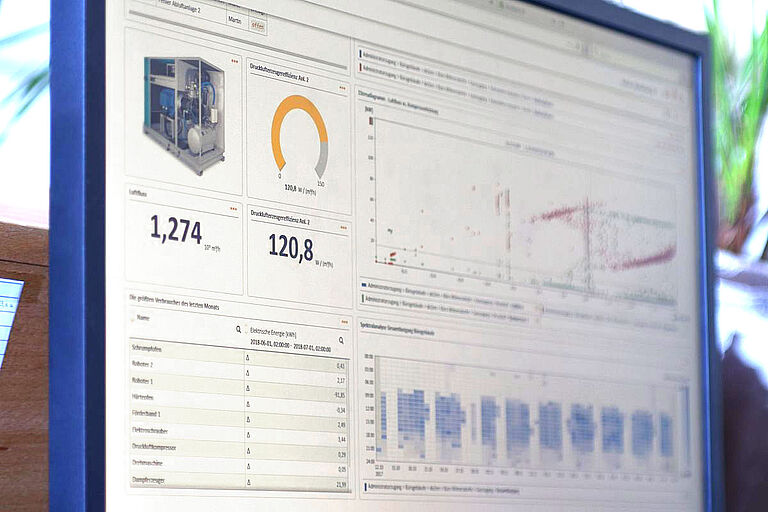
Configure individual Dashboards of diagrams, messages, images or more complex components with a few clicks to support your energy management or other data-based projects. Use the Dashboard as a portal for all modules of the deZem Energy Controlling Software. From there, click on to gain more in-depth insights, study abnormalities, generate reports or administer your energy controlling system.
Create a company-wide Dashboard that makes the essential energy consumption visible to a large target group in a cafeteria or lobby. Set up another Dashboard for controllers that shows the running energy costs and compares them with the previous year. There are many purposes and just as many dashboard possibilities!
deZemBoard is a modular system with a large number of interactive widgets that you can use quickly, easily and flexibly according to your wishes.
Why deZemBoard?
Small selection of widgets and features
- Current diagrams
- Rankings
- Speedometers and measured values
- Videos, live webcams, pictures, linked maps
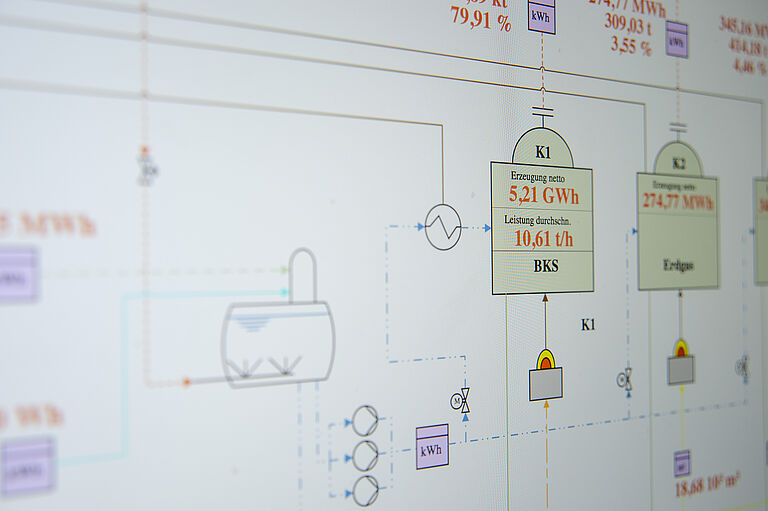
- Live process diagrams with a wide range of functions
- Informational texts
- Direct access to deZem software modules
- Use on smartphone and tablet
- Fast, individual configuration
Widget for sensor landscapes
A muscle pack for the Dashboard
- Process diagrams with current measured values
- Site plans with easily understandable allocation of measured values or calculations
- Interactive maps with many locations
- Monitoring of hundreds of temperature sensors in data centres
- Directly linked to more detailed analysis
With this deZem special widget, data are visualised in a customised way. Can be called up at any time, even via smartphone. Simple and intuitive configuration and customisation by the user.


