deZemVisVisualise and analyse IoT data
deZemVis is a DataSuite module that clearly presents and analyses metering data and other time series. Various charts enable quick identification of hidden issues, planning of optimisations, and evaluation of their success.
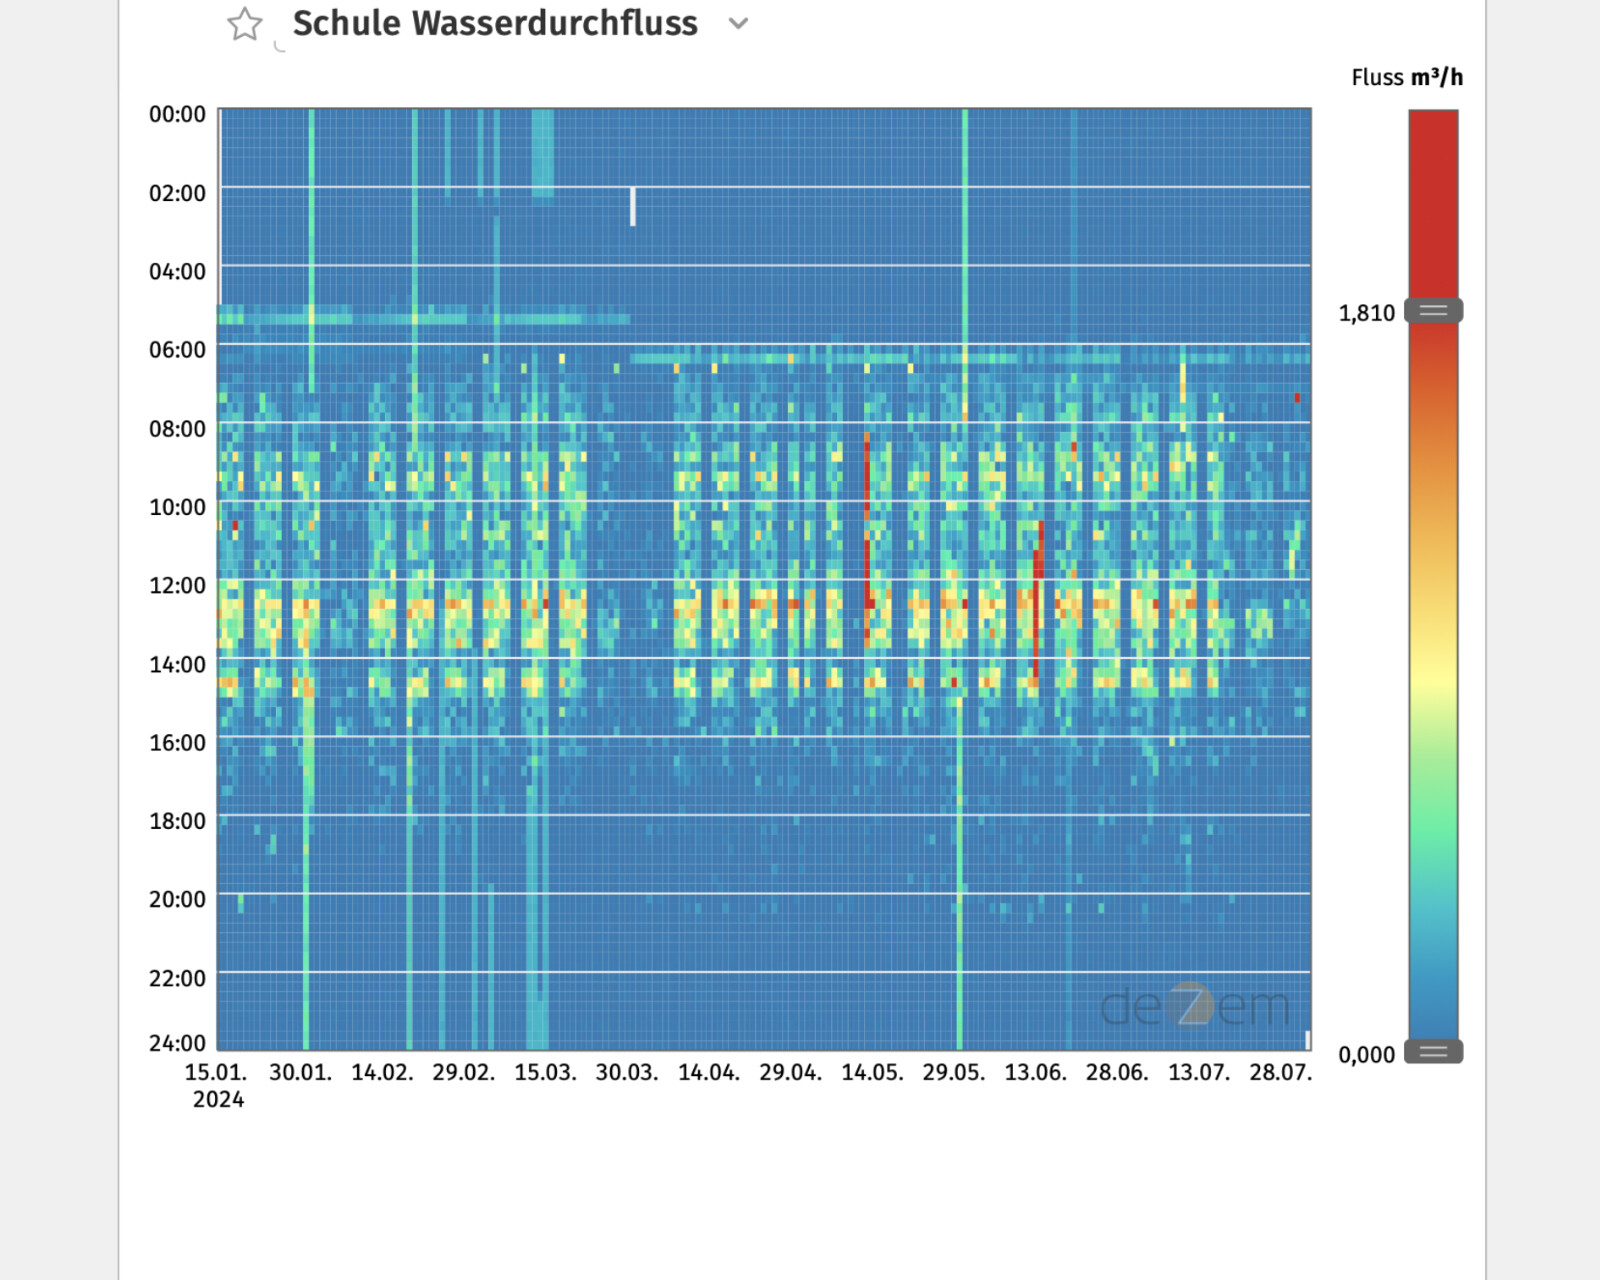
Ideal for high-resolution data analysis
deZemVis is the versatile tool for planning and evaluating optimisation measures. Our users particularly appreciate its detailed technical analysis and intuitive operation as an IoT analytics solution.
The module offers a wide range of applications - from energy management monitoring in buildings and factories to maintenance, environmental monitoring, agriculture and transport. As a powerful IoT solution, deZemVis is used by a broad spectrum of professionals, including top management, controlling, project leads and technical staff. While data is tailored to each user’s needs, all evaluations are based on the same consistent data set.
Our diverse customer base includes multinational industrial companies, major retail groups, smart cities, grid operators, municipal utilities and public property administrations.


All functions at a glance
deZemVis offers a wide range of diagram types and analysis functions, including:
- Different diagram formats: Column, line, scatter and grid charts.
- Sankey diagrams: For detailed flow charts.
- Min/max display: Emphasise extreme values in diagrams.
- Progression display of scatter diagrams: Track changes over time.
- Multi-diagram view: Several diagrams in view at the same time.
- Multivariate regression analysis: Investigate complex relationships.
- Differential, integral and mean value representation: Display important mathematical characteristics.
- Statistical models and correlation analysis: For in-depth analyses.
- Comment function: Automatic or manual annotations of patterns in the time histories.
- Bookmark: Save important views.
- Practical search and filter function: Find information quickly.
... and many other functions!


