IoT data always at your fingertips
Millions of sensor readings from machines, facilities and buildings arrive in the deZem IoT software every day. Visualising such Big Data in a way that is both easy to understand and allows for further analysis is a challenging task – even more so on small screens. In its latest update, deZem has therefore updated the design of the dashboard module deZemBoard and the visualisation and analysis module deZemVis. More importantly, deZem optimised the usage on mobile devices such that information is readily accessible and even in-depth analysis tasks can be performed ad-hoc on mobile devices.
A consistent and central database is the basis for identifying savings potential, monitoring processes, increasing productivity and automating operating procedures. However, in order to interpret machine-, energy- and environmental data, processes and their interactions, all this needs to be presented in a simple and comprehensive manner. In fact, it is often useful to clarify questions about anomalous or interesting data directly on site – on the smartphone.
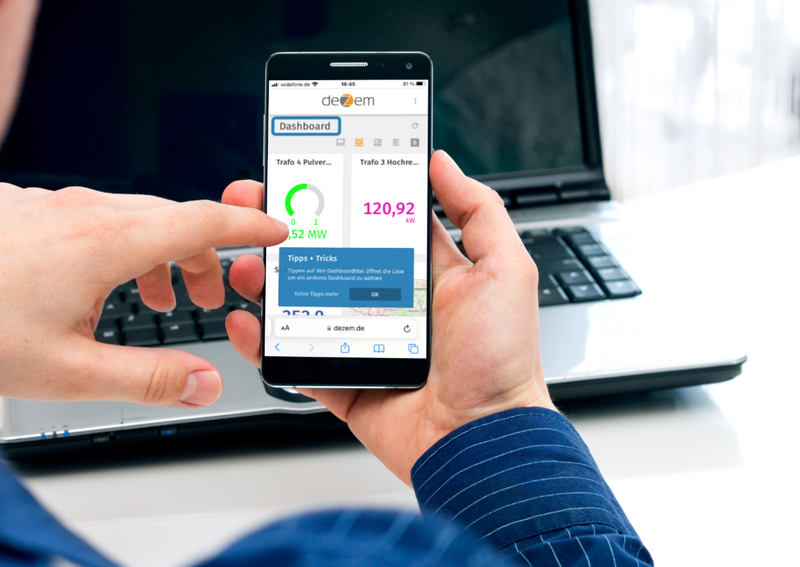
With the latest update, the deZem visualisation and analysis software can be operated conveniently on small screens such as smartphones or tablets: Current and historical data is displayed on dashboards in so-called widgets as curves, bars, sankey diagrams, and many more ways. Intuitive navigation supports deep-diving into every detail. Comparing different media and time periods, statistical analyses and tables are implemented in a visually catchy way. Interactive tips and tricks support users in their navigation.
Your smartphone as telescope and microscope for IoT data
Diagrams must show a lot of information – axes and labels, legends and much more. Therefore they are notoriously difficult to display on small screens, especially when it comes to interactive usage. With the new version of the deZem DataSuite, the inherent potential of smartphones is fully exploited to present all information clearly, and to intuitively explore more details by tapping, swiping, dragging, rotating, etc. Of course, the same dashboards can be used on the desktop, as before.
Comprehensive management of notifications, alarms and comments
The presentation of relevant information on the actual data has also been optimised for display on mobile devices. Icons show whether an alarm has been triggered, a colleague has commented on a measurement, or whether a sensor stopped delivering data.