The deZem sensor landscapes are interactive graphics on the deZem dashboards into which metering points from deZemVis can be integrated. In this way, metered values can be viewed live and for any point in time in the past. Limit violations can be detected immediately by means of colour changes.
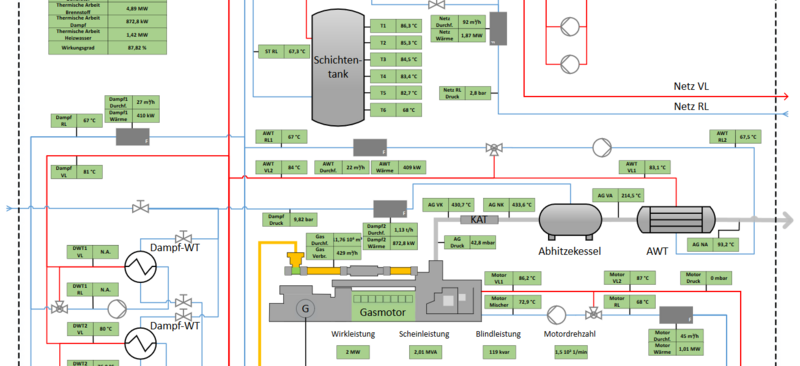
Sensor landscapes are zoomable and can be used as versatile process visualisations. With one click you can jump to the individual time histories in deZemVis with more analysis tools. Sensor landscapes are suitable for CHPs (see example on the right) as well as for industrial processes, plants, office buildings and all kinds of process visualisation. We will be happy to create them according to your wishes within a few days.
Your interactive sensor landscape is only one click away!